
How Our Water Sensor Came Close to Faking Results Thanks to an Enzyme From a Firefly

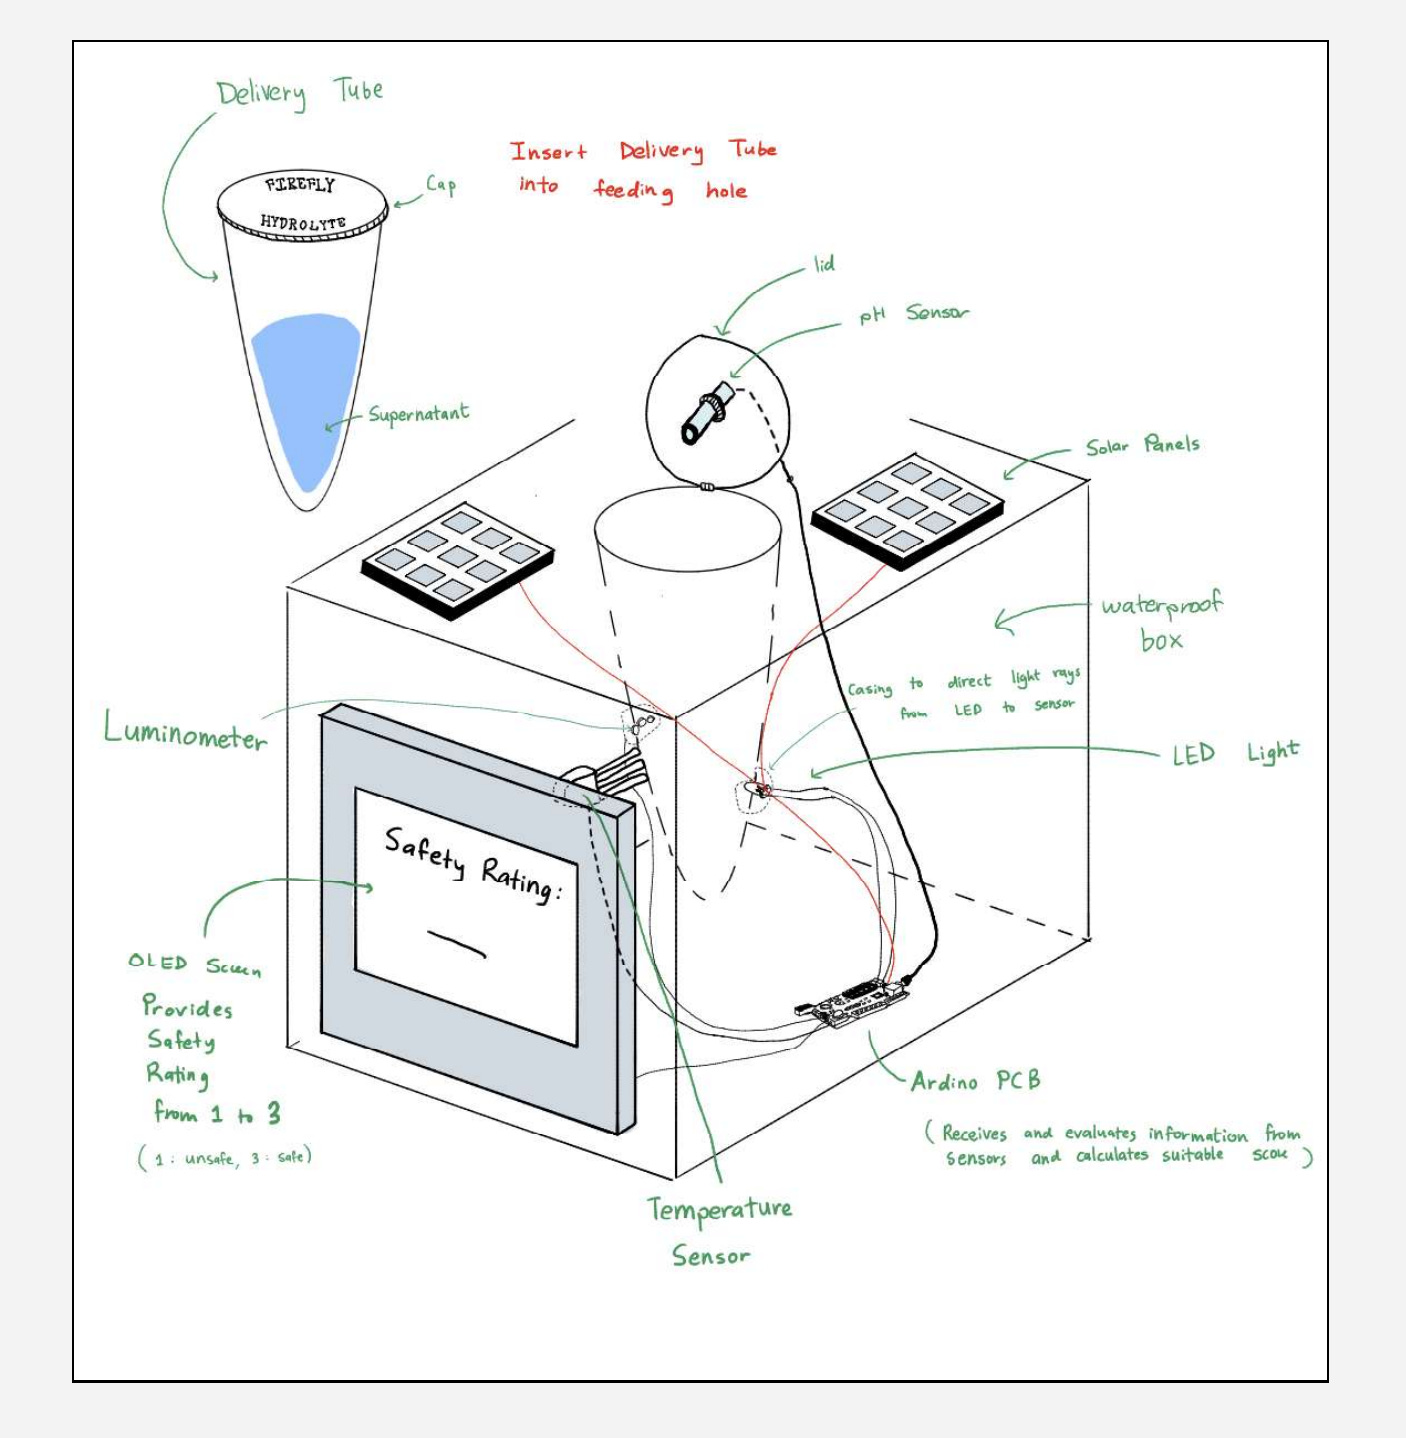
A team of five of us, myself included, built a water-quality-testing prototype we called the Firefly Hydrolyte. The idea was simple. Dip a sample into the device, walk away for a few minutes, come back to a safety rating on the screen. A rugged, low-tech solution for places where shipping samples to a lab and waiting three days isn't really an option.
My job was to make sure the device actually delivered on the claims we were making. That the readings could be trusted. It turned out to be a lot more interesting than I expected.
How the Device Detects Contamination
The main trick comes from the firefly. All living cells contain a molecule called ATP. There is an enzyme called luciferase that reacts to ATP and produces light:
The brightness is proportional to the amount of ATP in the sample. High ATP means a lot of living cells, because ATP breaks down once a cell dies. So a darker reading is actually the reassuring one. A bright reading means the water might be dangerous, which is the opposite of what your instinct says. The sample passes through a luminometer that counts the photons, and an Arduino turns the count into a safety rating from 1 to 3.
This would be the whole story, but it actually isn’t.
An Inherent Problem with Chemistry
Luciferase is fussy about temperature. Most enzymes are. When they get cold they go sluggish. When they get hot they fall apart. So the light output doesn't just depend on how much ATP is in the water. It also depends on how warm the water was when we measured it.
The published info on this is practically all we have (Activity curve from the literature — Bechara & Stevani, 2018):
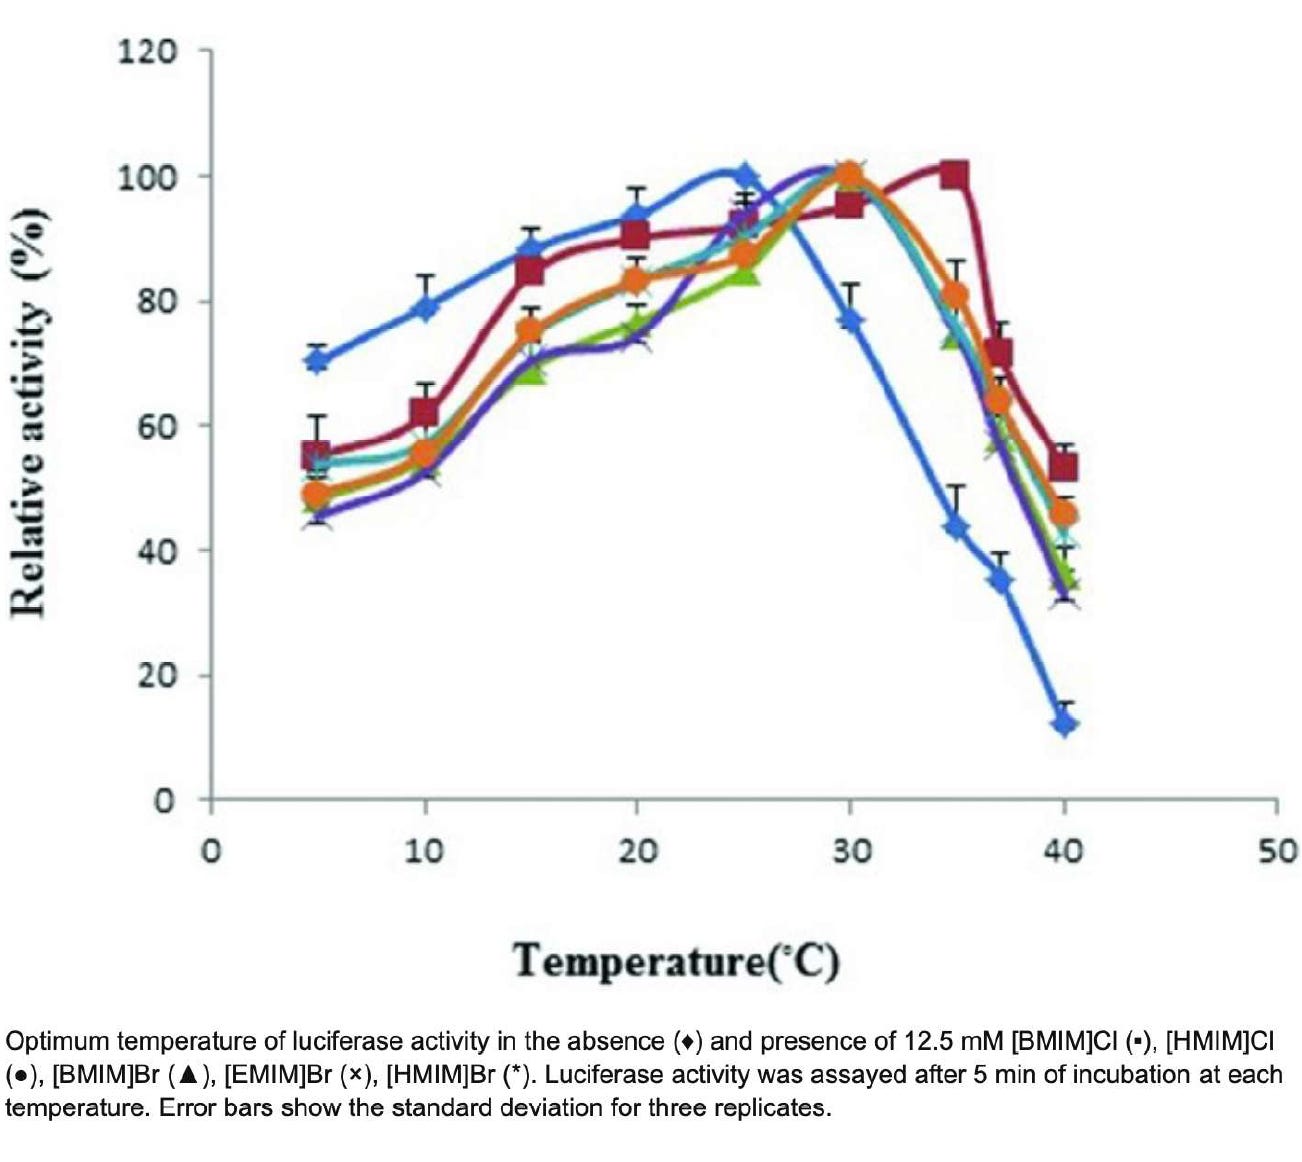
Since we didn't have a lab where we could measure enzyme kinetics ourselves, we used published values as our starting point. Worth flagging that this introduces real uncertainty. Published enzyme curves vary between studies, and the conditions in our device (buffer, pH, reagent purity) aren't identical to the conditions in the paper. We took the best data we could find and assumed it was close enough. Usually a fine assumption. Sometimes not.
Between 25 and 35°C, the enzyme runs at near 100% activity. At 5°C it drops to 50–70%. Above 37°C it falls off sharply. In practice, the same contaminated sample could glow nearly twice as bright on a warm afternoon as it would in cold mountain runoff.
This was the first real crack in what we’d built. I’d been assuming the device measured contamination. It doesn’t. Without correction, it measures contamination plus whatever mood the enzyme happens to be in that day. Two variables collapsed into a single number.
The Firefly Hydrolyte is meant to work outdoors, often near streams that can be much colder than a room. A device that only works at room temperature isn't very useful in the field. And if the same stream gets rated Unsafe in July and Fine in February, same water, just a different season, the rating can't really be trusted.
The fix: measure the temperature, then undo it
The correction has three parts. First, add a temperature sensor. Then use the activity curve to scale the raw reading back to what it would have been at the enzyme's peak activity. That way, readings can be compared regardless of the temperature at which they were taken.
The last step is a pretty basic math idea:
So if you measured a light output of 50 from a sample where the enzyme was running at 50% activity, the corrected value would be 100. If you measured 100 from a sample where the enzyme was at 96% activity, the corrected value would be about 104.
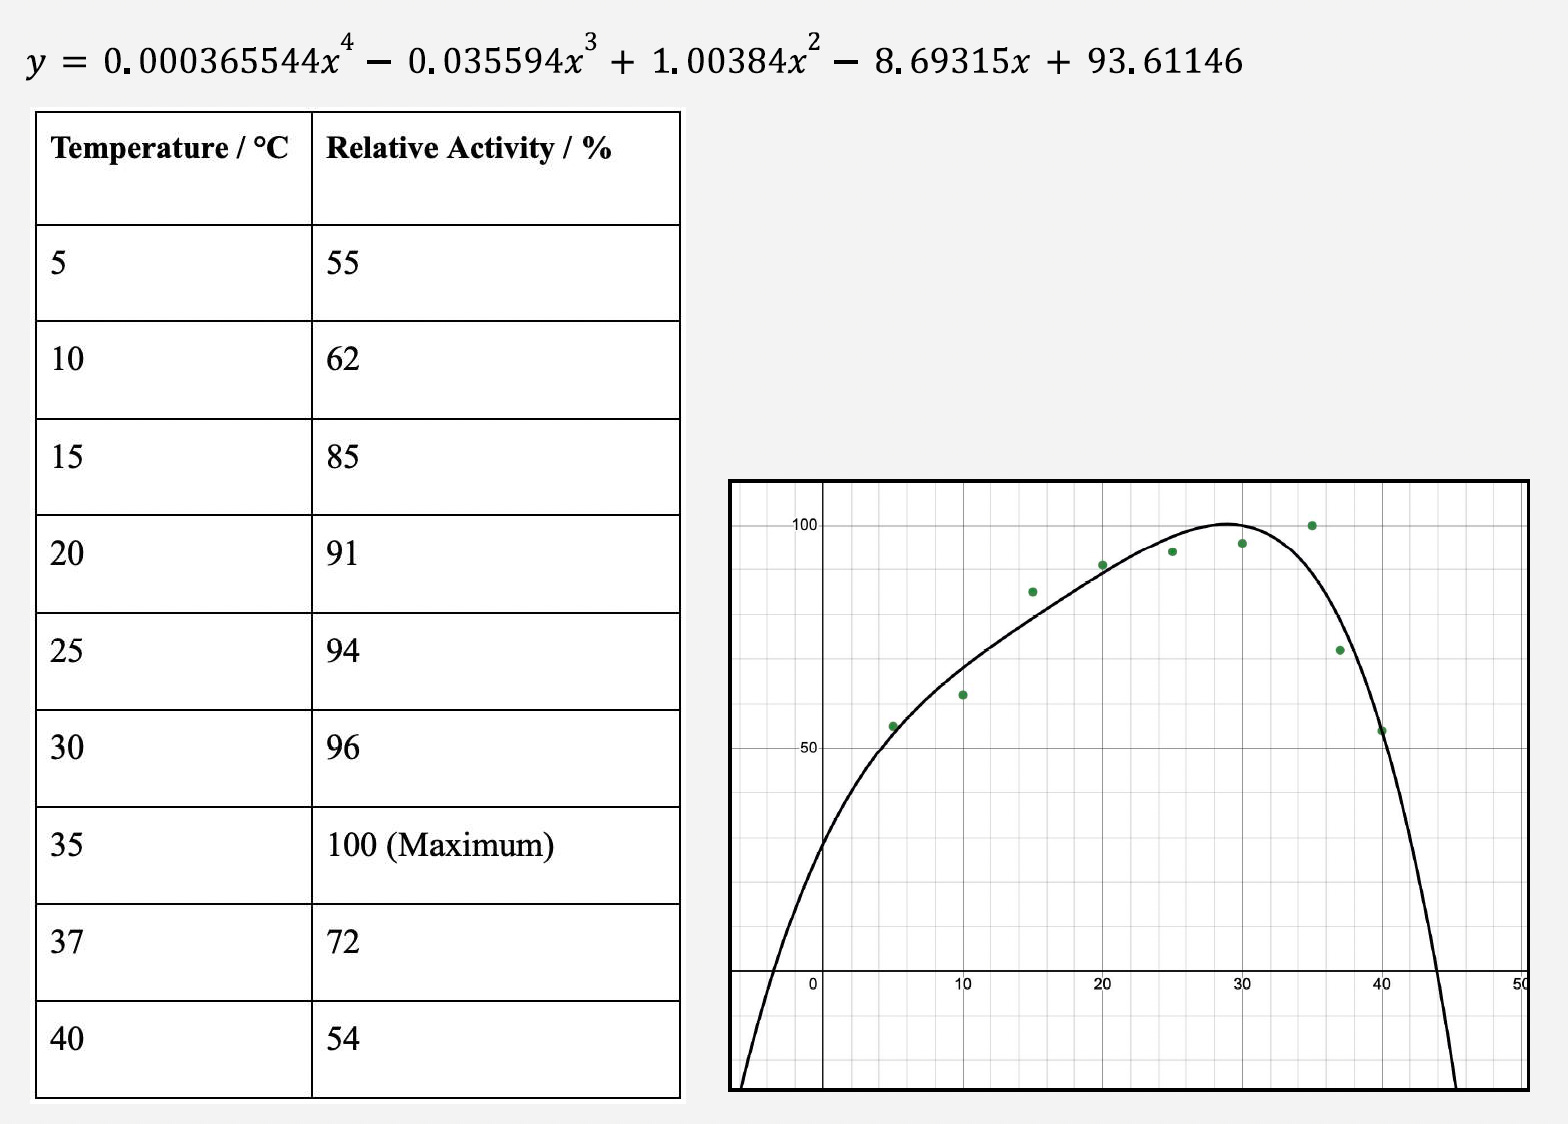
The hardest part was getting “relative activity at any given temperature” to actually live inside an Arduino. Published data only gives values at specific temperatures, but a sample could be at anything in between. We needed a continuous function. I ended up fitting a quartic regression to data points I'd read off the curve in Desmos:
You plug in a temperature, get a relative activity, and apply the correction. There is also a fail-safe. If either the pH or temperature reading is unreasonable, the device throws an error rather than confidently reporting nonsense. Since the entire problem we were trying to solve was the device confidently reporting nonsense, the fail-safe was not optional.
A quartic isn't meaningful in a biological sense. There's no theoretical reason enzyme activity should be a fourth-degree polynomial. But given the data we actually had between 5°C and 40°C, it was the best fit available. Honestly, it was also the only fit available. The fail-safe boundaries were there to stop the regression operating outside the data range, where it could happily generate garbage with full confidence.
Did it work?
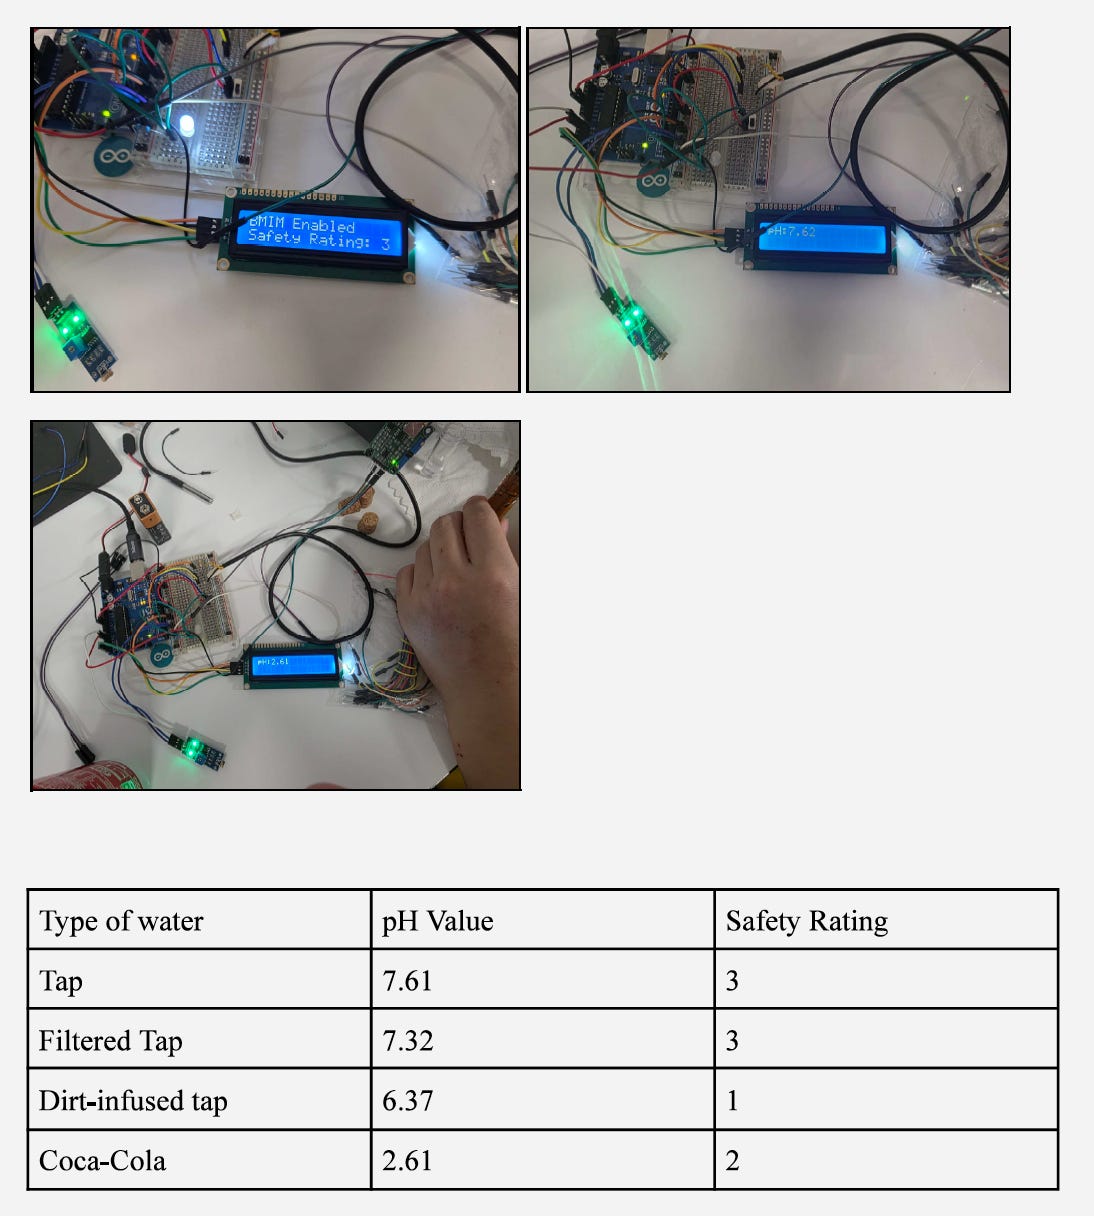
We tested three samples. Filtered tap water (clean), unfiltered tap water, and water we'd deliberately contaminated by adding dirt to it.
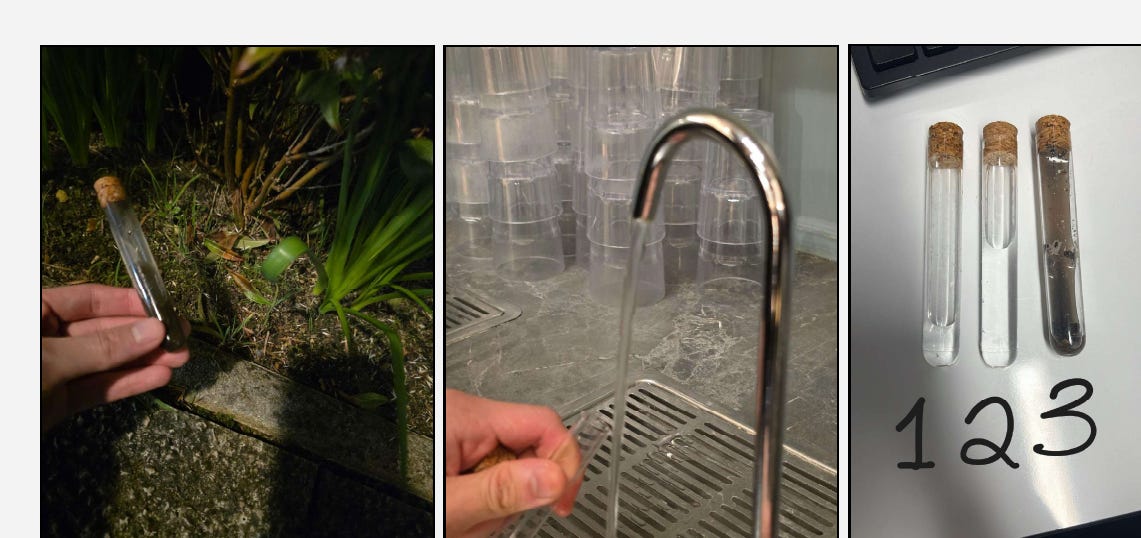
The results for dissolved solids were 87 mg/L, 303 mg/L, and 838 mg/L respectively, and the temperature adjusted safety ratings on the prepared samples were reasonable for the scenario.
What I learned
Most of the work that goes into a device like this happens in places nobody can see. The people who look at it don't see the correction equation. They see a number on a screen that is, conveniently, correct. What this project taught me is that a measurement is only ever as good as your model of what you're actually measuring. The gap between the glow and the contamination is where the most interesting, and the most worrying, part of instrument design lives.