
My Engineering Club Lecture: How to Identify a Leak
The hidden mathematics of listening to broken pipes — and why it's the same maths behind MRI scans, Wi-Fi, and MP3s.

The UK loses 3 billion liters of perfectly good drinking water every single day. The water is losing its fight against the damaged pipes beneath the ground. The cracks in the pipes are unrepaired since the pipes are neither easy to access nor easy to trace. I presented this problem to the Engineering Club and asked the following question:
What is the best way to locate an unseen and inaccessible leak in a pipe that we cannot dig out and repair?
My idea is that the solution is actually a simple answer. It is mathematics. More specifically, a type of math that originated about 200 years ago with a Frenchman interested in the movement of heat through metal.
Everything can be considered a signal
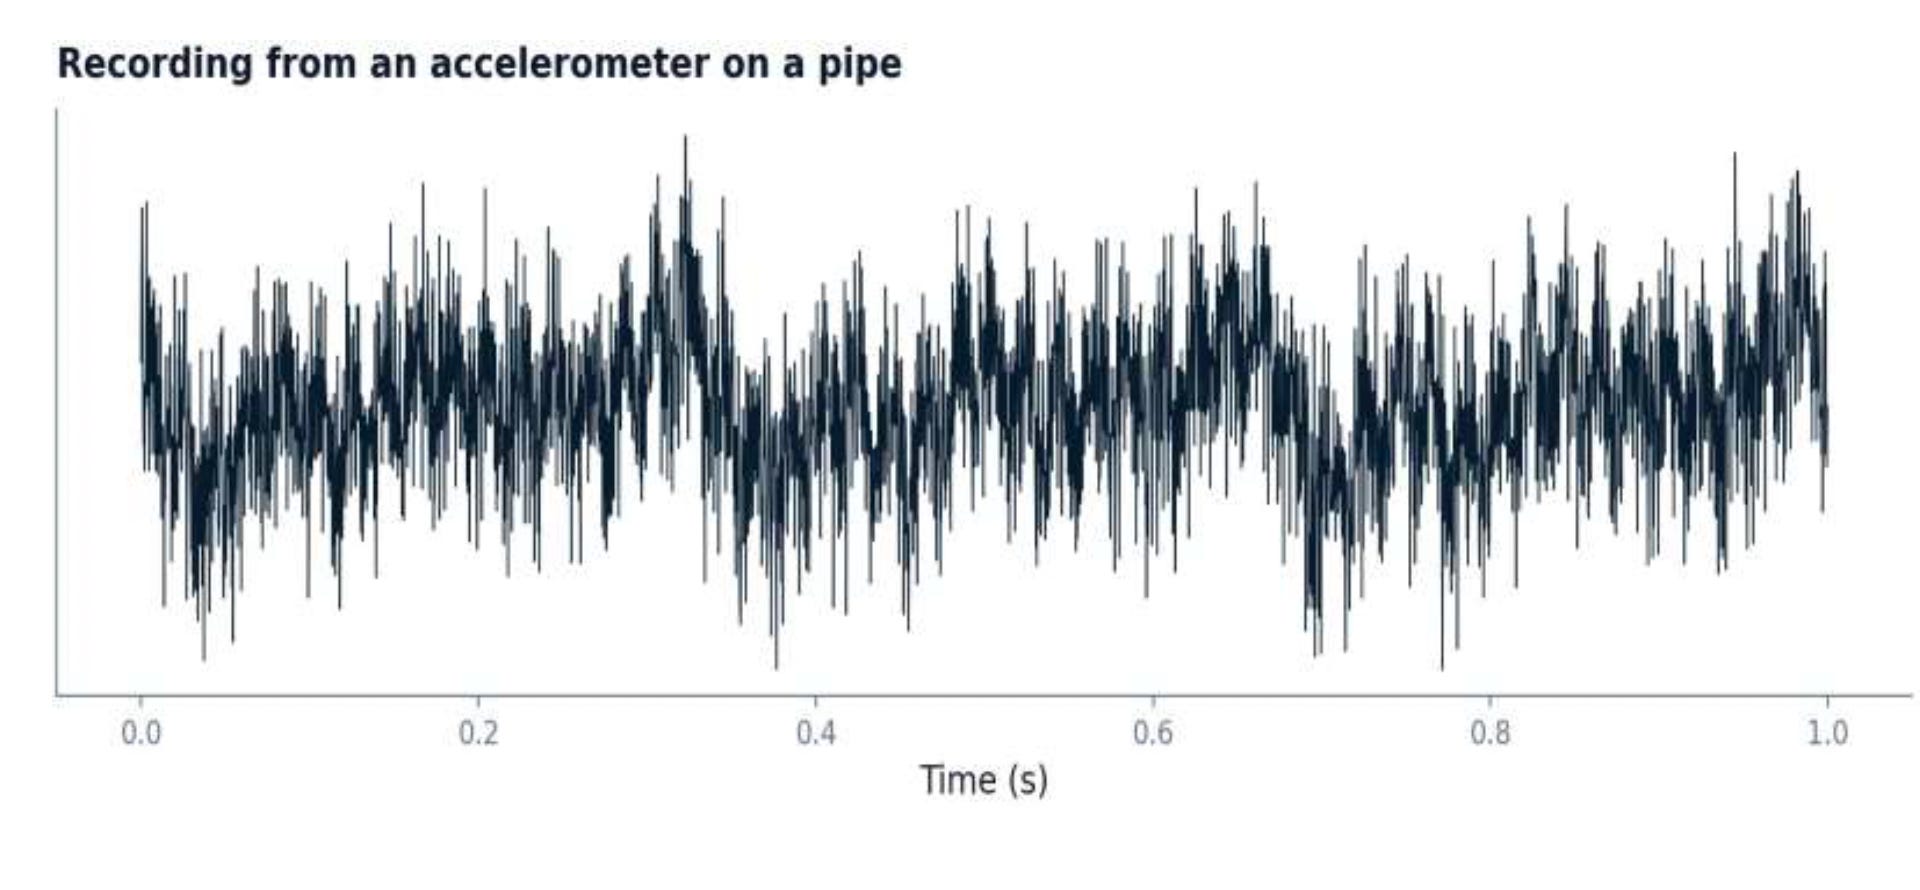
When sounds are made, changes in the air pressure are made over time. The sound of a heartbeat is the measurement of changing voltages over time. A pipe that is leaking also produces a vibration that is a measurement of amplitude changing over time. While most things can be considered a measurement of a changing signal, there is a problem. If you are looking at a raw measurement of a vibration, it will most likely appear to be a chaotic mess. It will be an honest measurement of a signal, but a wholly meaningless display of one.
This is represented in the graphs below.
The Cake and The Recipe
One raw signal is like a cake with no recipe. A raw signal is essentially a cake and with no recipe you can’t really decipher what the ingredients are. When you see a cake you probably think that the cake is the final product and the recipe is the process behind the creation of the final product. The Fourier Transform is the machine that turns the cake back into the recipe. The Fourier Transform tells us that any raw signal can be constructed by simple sine waves and that every frequency and every raw signal completely describes itself and makes a unique fingerprint and will be found by the transform. Just by knowing this and how to describe these simple sine waves allows us to create MRI images and Wi-Fi, MP3’s and JPG images.
Listening to The Pipe
When pressurized water leaks out of a pipe it causes a vibration in the pipe. When this vibration occurs it then starts a chain of acoustic emissions and these emissions will spread throughout the length of the pipe. If you put sensors above the pipe in the location where the emissions have spread, you can use the Fourier Transform and cross correlate both recorded signals. The time delay between when the emissions are heard will provide a location of the leak, sometimes within a meter of where the actual leak is, without having to lift a single paving slab.
The telltale sound of a leak is determined by pipe type. For metal, it’s the 100 – 1000 Hz range. For plastic, the range is 20 – 250 Hz. However, these frequencies are coupled with a 50 Hz mains hum, noise from low-frequency traffic, pumps, and random thermal noise.
In these situations, the philosophy of “noise” becomes interesting. Noise is not incorrect data. Noise is everything in the data that does not pertain to the answer of the question posed. To a leak hunter, a rumbling bus is considered noise. To a bridge engineer, the leak is the noise.
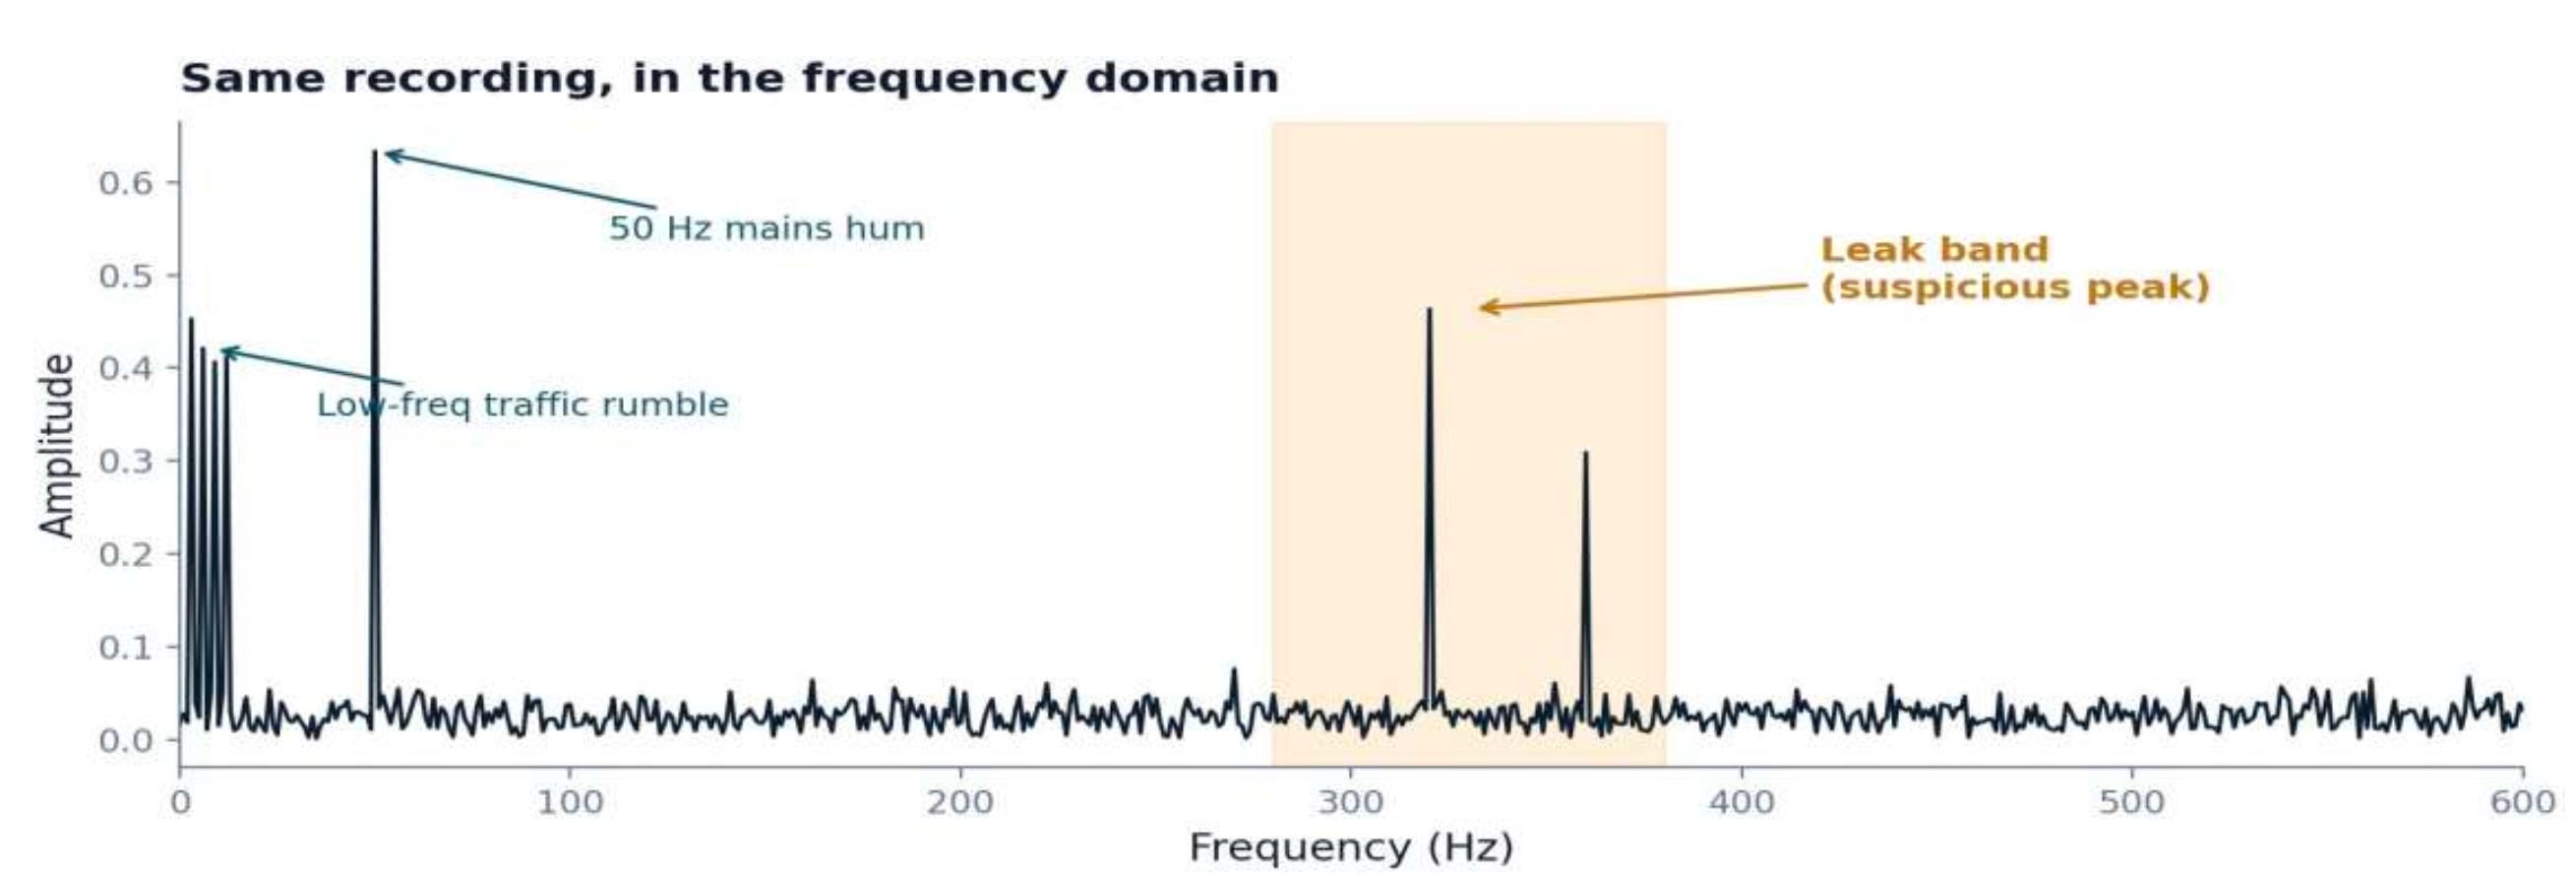
Same Data, Different Lens
The best example I could provide the club was the following. Take a recording that looks like chaos, and apply the Fast Fourier Transform. Suddenly, you can see. The rumble of the low-frequency traffic is in a clump on the left. The sharp spike of the mains hum is at 50 Hz. In the leak frequency range, there is a suspicious peak. Something is in that pipe.
You have not altered the data. You have altered the question to something you can now see.
The Bigger Picture
I wanted to end my lecture with a statement I hold dear. New infrastructure is simply old hardware and a new way to think about math. Civil engineering is becoming an information science.
Many infrastructure failures have tell-tale signs long before people realize they are happening. Data repeatedly sent out. The only question is if anyone is picking it up.
This was a lecture that lasted about an hour and a half. We began with signal math and moved into the Fourier Transform. After, we played a real pipe recording. We finished by revealing a hidden leak using frequency spectrum. If you want to go deeper look up acoustic leak detection and cross-correlation, and be warned: the rabbit hole is very, very deep.
My full presentation below
: